On this page: Learn & Practice | Picture Books
learn & practice
✏️ Khan Academy math modules. Khan Academy offers a wealth of free math educational resources, including a large library of instructional videos and online practice problem sets. – All
Tip – On Khan Academy, the Data Analysis modules are divided by grade. Grade 1 explains how to simple problems with bar graphs. Grade 2 gives practice in working with picture graphs, bar graphs, and line plots. Grade 3 teaches how to create, interpret, and solve problems with picture graphs, bar graphs, and line plots. Grade 5 covers graphing data on line plots and interpreting dot plots with fraction operations. Grade 6 includes a Data & Statistics module with a wide range of instructional materials on recognizing statistical questions, interpreting data sets, calculating the mean and median, creating and reading histograms, box plots, frequency tables, and dot plots, and interpreting quartiles, interquartile range (IQR), and mean absolute deviation (MAD).
✏️ Curve Fitting from PhET. Try this fun online simulation from PhET. “With your mouse, drag data points and their error bars, and watch the best-fit polynomial curve update instantly. You choose the type of fit: linear, quadratic, cubic, or quartic. The reduced chi-square statistic shows you when the fit is good. Or you can try to find the best fit by manually adjusting fit parameters.” – Middle • High
✏️ Plinko Probability from PhET. “Drop balls through a triangular grid of pegs and see them accumulate in containers. Switch to a histogram view and compare the distribution of balls to an ideal binomial distribution. Adjust the binary probability and develop your knowledge of statistics!” – Middle • High
▶️ What happens if you guess? from TED-Ed. “Will it rain tomorrow? How likely is your favorite team to win the Super Bowl? Questions like these are answered through the mathematics of probability. Watch this artistic visualization of your odds of passing a test if you don’t know any of the answers.” – All
picture books
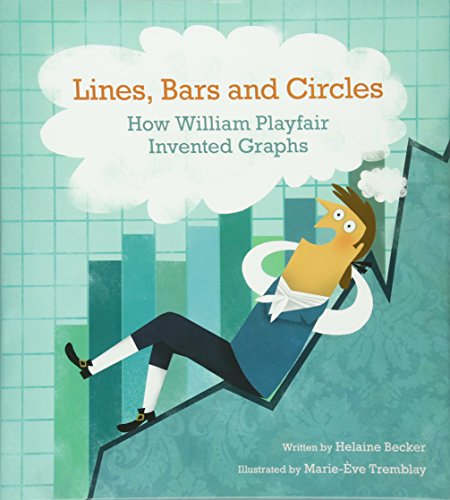
📖 Lines, Bars and Circles: How William Playfair Invented Graphics by Helaine Becker. This is a engaging picture book biography of William Playfair, inventor of the line graph, bar graph, and pie chart. Side bars give historical context and the end materials provide more detail. – Elementary
📖 That’s a Possibility! A Book about What Might Happen by Bruce Goldstein. What is possible? What is impossible? What is certain? Goldstein’s visually appealing picture book is a terrific and entertaining first introduction to the subject of probability. – Elementary


